YouTube Revenue Tracker
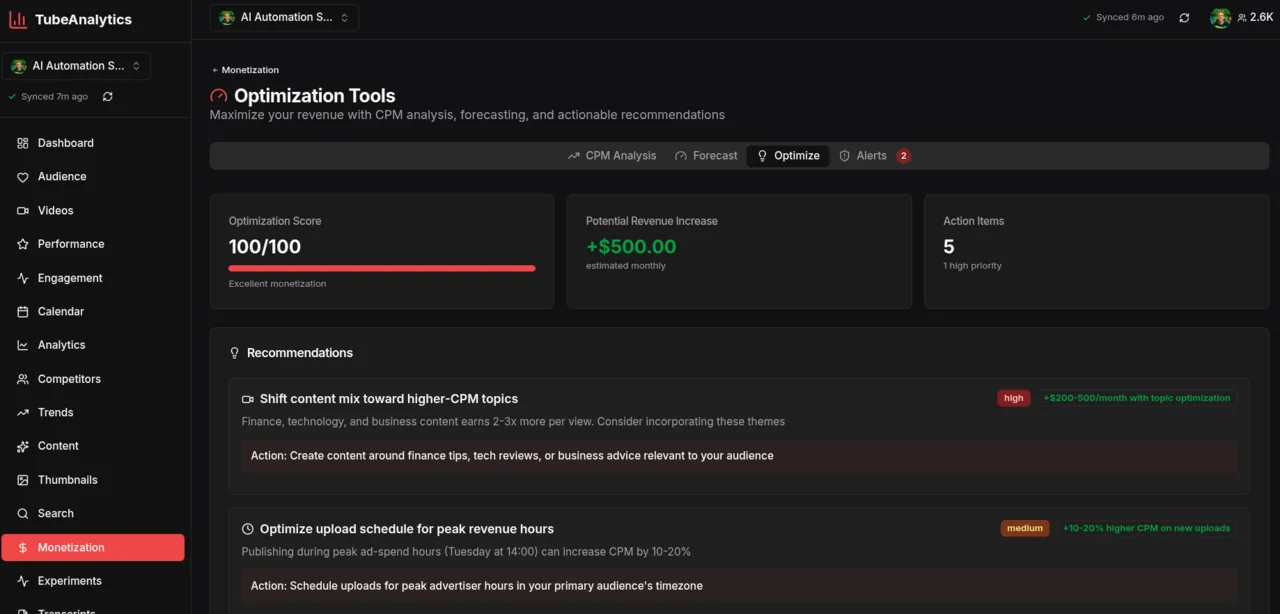
Which videos earn more per thousand views? Compare your connected channel’s reported RPM, CPM, and estimated revenue for the same period. Estimates are not finalized payouts.
Available on Professional ($49/mo) and Enterprise ($149/mo) plans.
Methodology and evidence
This page describes how TubeAnalytics structures owned-channel monetization data. Metric definitions are based on the YouTube Analytics API and the product's current reporting surface. Last reviewed on 2026-04-01.
- Revenue figures are sourced from the YouTube Analytics API, the same underlying source used in YouTube Studio for owned channels.
- Feature scope and plan availability are documented across TubeAnalytics feature pages and pricing pages.
- Interpretation guidance is cross-checked against TubeAnalytics methodology resources and public creator education references cited in-page.
When to use revenue analytics
This feature is designed for monetized creators who need diagnostic revenue insight, not just a single earnings total.
Use it when
- You want to know which videos, countries, and ad formats drive the most revenue per view.
- You need CPM and RPM trend context for planning uploads, sponsorship pricing, or audience targeting.
- You manage multiple monetization streams and want one reporting surface instead of scattered exports.
Do not use it when
- Your channel is not monetized yet and you only need growth analytics rather than earnings analytics.
- You want competitor revenue or CPM figures, which are private and unavailable through public APIs.
- You only need a top-line revenue total and do not need diagnostic breakdowns or forecasting.
Everything in Revenue Analytics
Six interconnected modules that turn raw YouTube monetization data into a clear plan for earning more per view.
CPM & RPM by Video
See cost-per-mille and revenue-per-mille broken down for every video individually. Identify which topics, formats, and lengths attract the highest-paying advertisers — and make more of them.
CPM & RPM by Video visualization
Geographic Revenue Breakdown
Understand exactly which countries generate the most ad revenue. US, UK, Canadian, and Australian viewers deliver 3–5× higher CPMs than most other markets. TubeAnalytics maps your revenue by country so you can optimize titles, thumbnails, and upload timing for your highest-value audiences.
Geographic Revenue Breakdown visualization
Ad Type Performance
Not all ad formats pay the same. Break down revenue by skippable pre-rolls, non-skippable ads, bumper ads, overlay ads, and display ads. See which ad types dominate your revenue and understand how your content length and viewer behavior affect the mix.
Ad Type Performance visualization
Revenue Forecasting
Project your channel's monthly and annual revenue based on historical CPM trends, seasonality patterns, and upload cadence. Plan channel investment and sponsorship rates with confidence.
Revenue Forecasting visualization
Sponsorship & Membership Tracking
Track revenue across all monetization streams — AdSense, channel memberships, Super Chats, and Super Thanks — in one unified dashboard. See which stream grows fastest and where to focus.
Sponsorship & Membership Tracking visualization
Revenue per Content Category
Automatically cluster your videos by topic and compare average CPM, total revenue, and revenue per hour of watch time across categories. Know which content buckets are worth doubling down on.
Revenue per Content Category visualization
Why geography is the highest-leverage CPM variable
According to YouTube Creator Academy data, US, UK, and Australian viewers generate 3–5× higher CPM than viewers in most other markets. That means a video that earns $5 RPM from a primarily US audience could earn less than $1 RPM from the same watch time in a lower-CPM country. Most creators have no idea how their geographic split is affecting their earnings until they look at this data.
TubeAnalytics Revenue Analytics maps your revenue contribution by country so you can see — at a glance — whether your highest-CPM markets are growing or shrinking as a share of your audience. If your US share drops 10 percentage points, you should expect a visible CPM decline. If you publish a video optimized for a US audience and it drives outsized US views, you will see the CPM impact immediately.
This view is not available in YouTube Studio. It is exclusive to TubeAnalytics Revenue Analytics on Professional and Enterprise plans.
Revenue signals this page emphasizes
These figures summarize the main operating assumptions behind the feature.
Referenced in the geography guidance section
Product behavior described in the page FAQ
Professional and Enterprise plan positioning
Revenue Analytics vs. YouTube Studio
YouTube Studio tells you how much you earned. TubeAnalytics tells you why — and where to earn more.
| Capability | TubeAnalytics | YouTube Studio |
|---|---|---|
| Revenue by individual video | Yes | Yes |
| CPM breakdown by geography | Yes | No |
| Ad type performance split | Yes | No |
| Revenue forecasting | Yes | No |
| Revenue per content category | Yes | No |
| Sponsorship revenue tracking | Yes | No |
| Revenue trend alerts | Yes | No |
| Multi-stream revenue dashboard | Yes | No |
Comparison based on YouTube Studio features as of April 2026.
Official YouTube API
Revenue data sourced directly from the YouTube Analytics API. No estimates — the same certified data as YouTube Studio.
Hourly Sync
Revenue data refreshes every hour so you can track the impact of new uploads and CPM fluctuations in near real time.
5-Year History
Enterprise plans retain up to 5 years of revenue history so you can analyze long-term CPM trends and seasonal cycles.
Why TubeAnalytics
The only third-party tool with authenticated YouTube ad revenue data
Every other third-party YouTube analytics tool estimates your revenue based on public view counts and industry-average CPM rates. Social Blade, VidIQ, and TubeBuddy all use this approach — which can be off by 3-5x for most channels because they don't have access to your actual CPM, RPM, or monetized playback rate.
TubeAnalytics is different. We connect directly to the YouTube Analytics API via OAuth — the same API that powers YouTube Studio's native reports. This means every CPM, RPM, and revenue figure you see in TubeAnalytics is authenticated data pulled from YouTube itself, not an estimate based on averages.
Authenticated via YouTube API
Estimated from public views
Estimated from CPM averages
Estimated from category data
For creators making content decisions based on earnings, the difference between estimated and authenticated data matters. A single video's RPM can determine whether a topic, format, or audience segment is worth pursuing. TubeAnalytics gives you the real numbers — no estimates, no projections.
YouTube Revenue Tracker — Common Questions
Everything creators ask before connecting their channel revenue data.
- How accurate is the YouTube revenue data in TubeAnalytics?
- Revenue data is pulled directly from the YouTube Analytics API — the same data source YouTube Studio uses. CPM, RPM, and estimated revenue figures in TubeAnalytics match exactly what you see in YouTube Studio. There is no estimation or modeling for the raw figures; TubeAnalytics adds geographic breakdowns, ad type analysis, category clustering, and forecasting on top of this certified base data.
- What is the difference between CPM and RPM on YouTube?
- CPM (cost per mille) is the amount advertisers pay per 1,000 ad impressions on your videos. RPM (revenue per mille) is how much you actually earn per 1,000 video views after YouTube takes its 45% cut and accounting for views that generate no ad impression at all. RPM is almost always lower than CPM. TubeAnalytics tracks both because CPM tells you advertiser demand in your niche, while RPM tells you your real-world earnings rate.
- Can TubeAnalytics show me which countries generate the most revenue?
- Yes. The geographic revenue breakdown maps your CPM, total revenue, and revenue share by country for any time period. Most channels find that the US, UK, Canada, and Australia account for a disproportionate share of ad revenue despite representing a smaller fraction of total views. This view helps creators tailor content, upload timing, and topic selection toward high-CPM markets.
- Which plan includes Revenue Analytics?
- Revenue Analytics is available on the Professional plan ($49/month) and Enterprise plan ($149/month). The Starter plan ($19/month) includes basic revenue totals but does not include geographic breakdowns, ad type splits, revenue forecasting, or category analysis. All plans come with a free trial.
- Does TubeAnalytics track revenue from YouTube channel memberships and Super Chats?
- Yes. TubeAnalytics consolidates all revenue streams available through the YouTube Analytics API: AdSense ad revenue, channel memberships, Super Chats, Super Thanks, and YouTube Premium revenue share. Each stream is shown separately so you can see which drives growth and which is declining.
- How does revenue forecasting work?
- Revenue forecasting in TubeAnalytics uses your historical CPM by month, typical view velocity for your channel, your average upload cadence, and seasonal ad spend patterns (Q4 CPM is typically 40–60% higher than Q1 for most niches) to project monthly and annual revenue ranges. Forecasts are updated each time new analytics data syncs, typically every hour.
- Can I see why my CPM dropped?
- TubeAnalytics surfaces CPM drop alerts alongside context: a drop in the US share of your views, an increase in mobile traffic (mobile CPMs are lower on average), a shift toward lower-CPM ad categories, or a seasonal pattern. This gives you actionable signals rather than just a raw number change.
Related Features
Audience Intelligence
Demographics and geographic revenue analysis.
Review audience revenue insightsCompetitor Tracking
Benchmark your revenue metrics against similar channels.
Compare competitor revenue patternsTopic Experiments
Find which content categories earn the most per view.
Explore topic revenue experimentsStart tracking what your channel earns
See authenticated CPM and RPM for a channel you connect. Professional plans start at $49/month.